Business Intelligence: Where it's Failing and How to Keep Up
DataGPT is a the world’s first Conversational AI Analyst. For business users, it revolutionizes data analysis by letting you talk directly with your data, delivering instant, analyst-grade insights for smarter business decisions.


The Power of Objective Insights
Sharing a compelling story and engaging your audience is important, but to establish credibility, one must back up a story with proof. According to a study published in Communication Research, statistical evidence is more persuasive than anecdotal evidence in influencing beliefs.
Members of organizations are expected to make an impact and contribute to the team. Managers and coworkers expect reports showing that impact. This principle applies to the entire organization, with companies reporting overall financial performance through annual reports. However, the question that remains unanswered is how to locate relevant data and effectively incorporate it into such reporting.
Data-Driven Reasoning
One of DataGPT's core values is the importance of using data-driven decision making over opinions. We focus on using tangible data and measurable results for analysis, as opposed to hypotheticals or personal beliefs. Supporting arguments with data is the key to success, and it should be the default mode of reasoning.
However, merely having data without the power to utilize it to tell a compelling story renders it useless. A compelling story typically features characters, the obstacles they face, possible solutions, and an ultimate resolution. For instance, imagine you are a member of a marketing team that aims to acquire new users. You may face a situation where your efforts do not bring the expected results for specific devices. You hypothesize that the issue is not related to your marketing campaigns. In such a scenario, if you need to convince management that external factors rather than your performance are to blame, your story might follow this structure:
This example highlights that while data-driven reasoning is a necessary and rational approach, assembling all the necessary data in one place can be a complex and challenging task, and is often outside the scope of business users. For instance, attempting to segment millions of users and identify data attributes that may indicate an issue is a daunting task. This challenge was one of the main reasons for the significant growth of the Business Intelligence field over the last decade.
The Broken State of Analytics: Harnessing Big Data
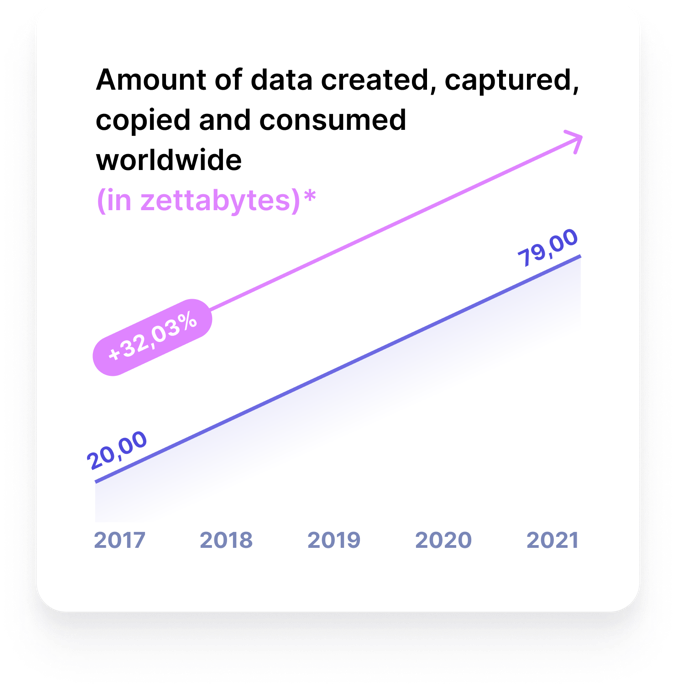
According to a study published in the Harvard Business Review, the past decade has witnessed a significant transformation in analytical technology, leading us to the era of Big Data. This transformation has been made possible by the advent of cloud-based analytics, which has enabled organizations to simultaneously access more computing power at a lower cost. In addition, the task of converting unstructured data into a structured format suitable for statistical analysis has become significantly easier. Due to these advancements in technology, organizations are now storing vast quantities of diverse data types. As a result, the volume of data generated, captured, duplicated, and consumed worldwide has surged from 2 zettabytes in 2010 to 64.2 zettabytes in 2020.
As a result of these trends, the global business intelligence market has been valued at USD 27.11 billion in 2022 and is projected to grow to USD 54.27 billion by 2030. Companies are investing millions of dollars annually in attempts to analyze data, but are falling short of the results they expect, because the data analytics industry is fundamentally broken. This is primarily due to companies utilizing fragmented toolsets that require a high level of expertise to utilize.
To illustrate this point, let's consider a real-life scenario where you are a member of a marketing team responsible for running campaigns involving millions of users. To streamline your work, you use well-known tools such as Google Analytics to track website traffic, a CRM system to manage campaigns and gather data, and a data warehouse to store all collected product usage data. With at least three sources of data, it becomes overwhelming for business users to understand the technical details and combine the information from various tools into actionable insights. Consequently, the next logical step for most business users is to seek assistance from the data team.
Uncover Data
The Dark Side of Dashboards: When Analysts Become Builders
As a business user you may not be aware of the processes that occur behind the scenes when you make a data request and receive the requested data in either an Excel spreadsheet or through a dashboard such as Tableau or Looker. To simplify the understanding of the Data Team's role in helping with data requests, imagine the following general data stack:
- First, data must be collected and stored from multiple sources
- Next, the data is extracted from those multiple sources
- The data then goes to the data warehouse, where it is usually unstructured
- The data must be transformed to enable analysis
- Finally, a BI tool is used to create visualizations or dashboards
Let us now examine our marketing data example, and suppose that steps one to four have already been accomplished and your data request was promptly given priority. It can still take several months to get approval for a new dashboard based on the data team’s backlog!
Once a Data Team member receives a request, they work on creating dashboards or charts to show the results, for example explaining why website traffic is high but the number of registrations is low. Unfortunately, traditional BI tools do not have a predefined algorithm to show the relationship between metrics, such as the number of website visitors and the number of new registrations. Additionally, these tools do not allow for the extraction of all segments for each metric to identify which characteristics of the audience had the biggest impact on the metric. In this example, the Data Team member must manually create separate charts for different segments (such as devices or locations) for each metric individually.
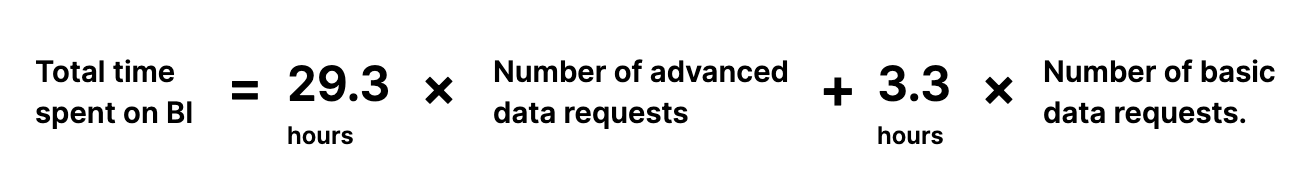
According to a Tableau survey conducted in 2018, creating a basic dashboard can take around 3.3 hours on average, while a more advanced dashboard with complex visualizations and multiple data sources can take up to 29.3 hours. Therefore, it takes at least three business days to prepare the first draft of a dashboard. However, even after a dashboard is completed, it may not suffice for the business user who requested it, and this may result in additional new data requests.
Let's do some calculations. While we used the marketing team as an example, companies have sales, customer success, operations, product, and other teams that require data. Hence, Data Teams spend numerous hours fulfilling data requests.
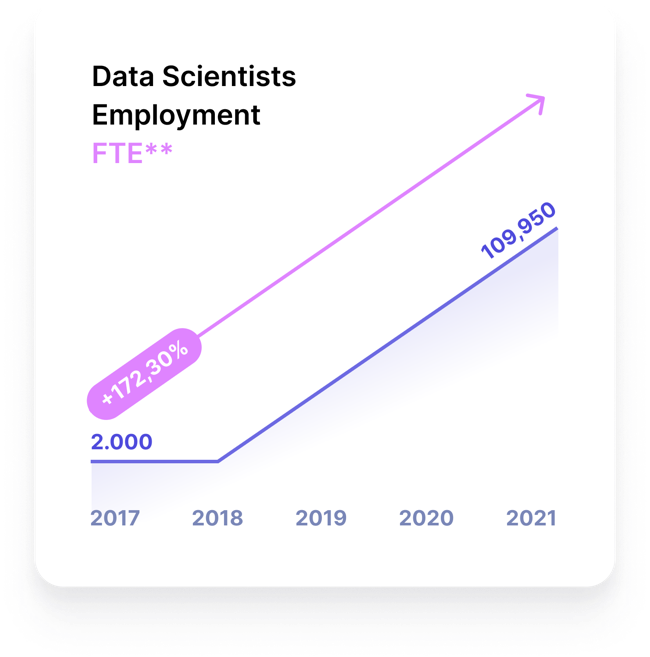
Assuming that requests for at least one advanced dashboard and one basic dashboard are made by the marketing, sales, customer success, operations, and product teams every month, completing all the requests would require 163 hours, or at least 20 business days. This underscores the need for at least one team member to be solely dedicated to designing dashboards and explains the rise in the number of data scientists from 2,000 FTE in 2017 to 109,950 FTE in 2021 according to the US Bureau of Labor Statistics.
Simply having a dedicated dashboard creator, however, does not guarantee high-quality data analysis. When dealing with time-consuming data requests, there is a risk of rushed and error-prone analysis, as well as the development of overly complex dashboards. This creates a significant challenge for the data team in finding a balance between meeting technical requirements, such as creating dashboards, and making a real impact by uncovering insights that can be game-changers for the business.
Business Intelligence Adoption Fails
A Data Team has a broader range of responsibilities than simply fulfilling data requests; they perform multiple functions with the aim of helping the company make informed strategic decisions:
- Data Architecture: Designing and implementing a robust and scalable data infrastructure, ensuring data security and accessibility.
- Data Management: Managing and optimizing databases, ensuring that data is consistent, accurate, and up-to-date.
- Data Storage and Retrieval: Storage, retrieval, and management of data in a manner that is efficient and easily accessible.
- Data Analytics: Utilizing advanced analytics techniques such as machine learning, data scientists can extract insights and generate predictions from data, helping to drive business decisions.
- Data Visualization: Creating visually appealing and user-friendly dashboards, charts, and reports to facilitate data analysis and communication.
- Data-Driven Decision Making: Leveraging data across various functions, organizations can drive better decision-making, optimize performance, and achieve business objectives.
Although all functions are equally important, data teams often prioritize data visualization and rely on manual tools that limit their effectiveness. Avoiding automation in technical work can hinder the ability to achieve impactful results.
To refocus on their primary objective of assisting the company in making informed strategic decisions, data teams must give equal attention to all functions. To reduce the workload of the data visualization function, data teams should strive to promote high adoption levels of business intelligence tools by business users throughout the company.
However, as per the BI & Analytics Survey 22 conducted by BARC, the average adoption rate of Business Intelligence tools by employees is only 15%. Our internal research indicates that the primary reason for this low adoption rate is the inability of traditional BI tools to facilitate the discovery of valuable data insights. This is mainly due to their complex setup and lack of user-friendliness when it comes to presenting data. Such can create a vicious cycle for the Data Team, whereby they become trapped in the process of dashboard creation, rather than facilitating data-driven decision making.
Construct Data into Argument
Staying Sane While Navigating Multiple Dashboards
Once the prolonged waiting period for data requests is finally over, business users are typically presented with multiple dashboards, each containing several different charts. The main issue with this approach is that the data request is typically designed to test a specific hypothesis, rather than to tell a complete story. As Forbes points out, while a dashboard can frame multiple key metrics and dimensions, it is not an effective way to tell multiple stories simultaneously.
As a result, business users are left to manually connect the dots between different charts and dashboards in order to find meaningful insights. This is largely due to the limitations of traditional BI tools, which do not allow for the analysis of all audience segments in a single view, nor do they highlight which segments had the greatest impact on key metrics changes. This manual process can be both time-consuming and frustrating.
To overcome this challenge, business users should be provided with Automated Insights, which can help to identify key drivers and accelerate the speed of storytelling. By using these automated tools, business users can gain a deeper understanding of their data and make more informed decisions that drive business success.
Leveling up to the New Era of Data Analytics
Use DataGPT's Data Navigator & Insight Drilldowns
DataGPT is that product - DataGPT transforms data analysis from complex and time consuming to as effortless as having a conversation. Unleashing real-time and effortless analytics into the hands of data teams, DataGPT enables them ask any question of their data and to create dashboards 10 times faster, leading to 10 times more efficient data-driven decision-making by business users.
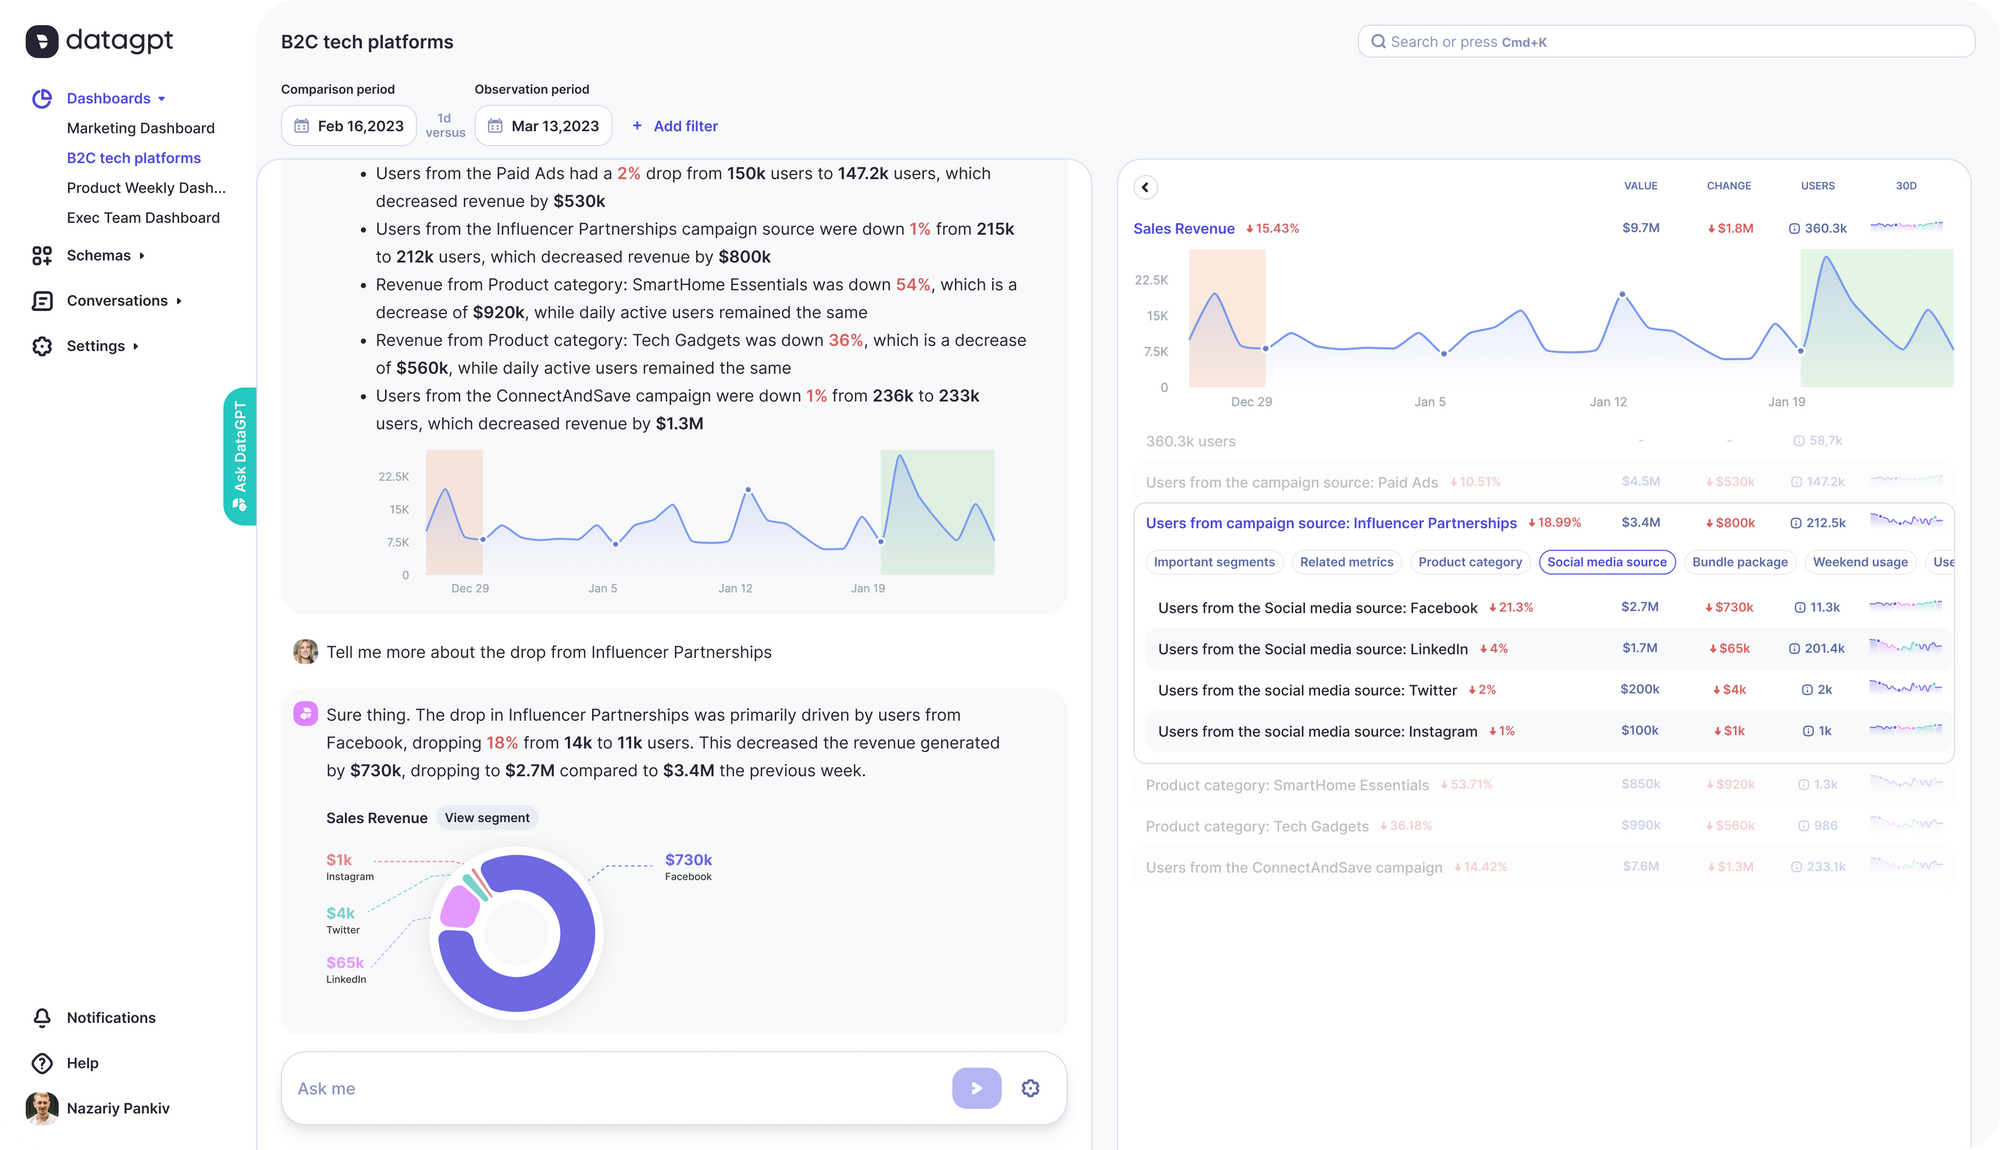
Furthermore, DataGPT's one-click Drilldown is a feature that enables users to explore their data instantly in greater detail. By clicking on a particular segment, users can access impactful segments, related metrics, dimensions, and other relevant data points. This allows for deeper analysis and understanding of the data, which can help users make more informed decisions. Essentially, the Drilldown feature provides a way to dynamically navigate through the data, providing more detailed information for specific segments.
Let's take the example of a marketing data request we considered.
The data team will write simple SQL queries that define their data schema and DataGPT's algorithm will automatically eliminate 99% of the irrelevant data and prioritize the most significant segments, without relying on Black Box AI or ML technology – only DataGPT's advanced data science and analytics computations.
"DataGPT has made our data analysis team 10x more efficient. We can stay on top of inbound requests, which frees us up to do more important analysis we had never been able to prioritize." Emmett Storts, Data Analyst at Product Hunt
DataGPT is a the world’s first Conversational AI Analyst. For business users, it revolutionizes data analysis by letting you talk directly with your data, delivering instant, analyst-grade insights for smarter business decisions. Furthermore, DataGPT's centralized dashboard eliminates the need to navigate through multiple views and data points. You can get answers to all of your questions and access all relevant information in one place and drilldown into any dimension. Don't believe it? Check it out for yourself below!
Sounds good to be true? Schedule a Demo
About Author
Arina is EX - Strategy & Operations at PwC, and EX - Director, Strategy & Operations at US Mobile. She served in a leading and critical capacity on projects for billion dollar companies. Reach out to her at arina@datagpt.com